Purpose-built for iGaming operators
iGaming Analytics
Built for Growing Operators
Launch in 1 week
Free data migration
Dedicated Support Manager

What Is iGaming Analytics?
iGaming analytics is the process of turning raw operational data — registrations, deposits, game sessions, bets — into decisions. Which acquisition channels bring players who actually deposit? Which games and sports generate the most GGR? Which payment systems have the highest failure rates?
Without dedicated dashboards, operators choose between two bad options: manual exports that take days to produce, or generic BI tools that require a data team to maintain. InTarget’s Analytics module is a third path — dashboards purpose-built for iGaming data structures, available directly in the platform from day one.
No pipeline setup. No SQL. No waiting for an analyst. Open InTarget, apply filters, get the answer.
Every dashboard is designed for the specific data structures of iGaming: registration refcodes, UTM attribution on deposits and bets, GGR and RTP calculations, sportsbook markets and bet types, bonus vs. real money separation, multi-currency normalization. This is not a generic analytics tool adapted for iGaming — it is built for iGaming from the ground up.
Registration Cohort Metrics — Measure Acquisition Quality
Registrations are only valuable if they lead to deposits. Registration Cohort Metrics tracks the full funnel — from registration through first, second, and third deposit — grouped by the time period players signed up.
This is the dashboard that answers the question most acquisition teams cannot: of the players acquired last month via each UTM source, refcode, or country, how many actually deposited — and how much did they generate?
Key metrics include First Deposit Conversion, Revenue Per Registration, Repeat Rate, and Second and Third Deposit Conversion. Block by UTM Campaign or Refcode to compare acquisition channel quality. Block by Country to identify your strongest markets. Block by Week or Month to track cohort performance over time.
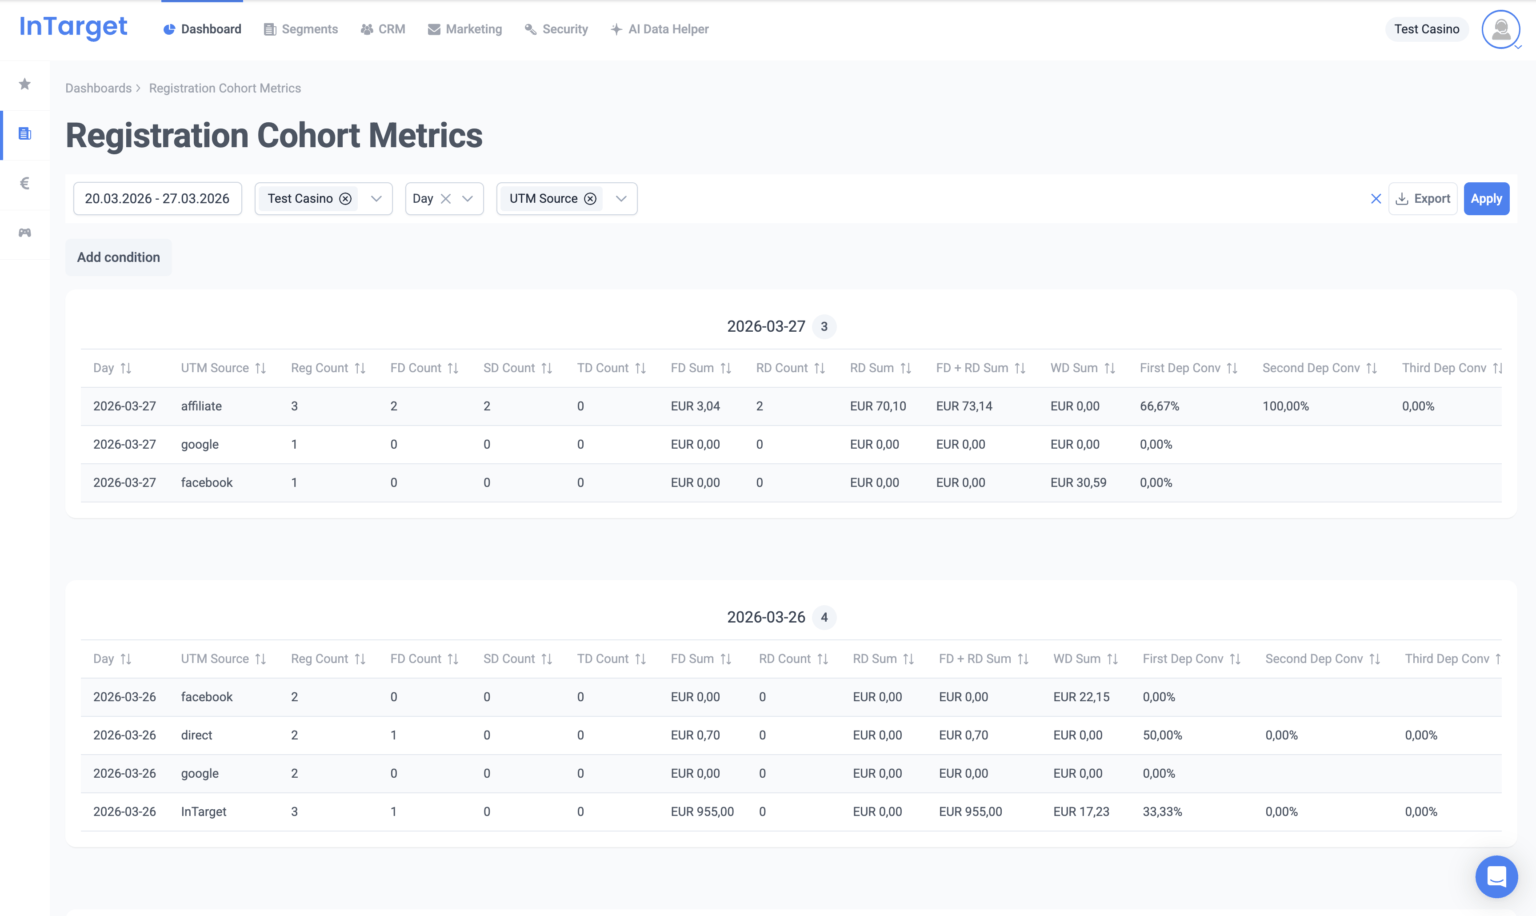
Can I filter Registration Cohort Metrics by affiliate or referral code?
Yes. The Refcode dimension is available as both a Block By option and a filter condition in Registration Cohort Metrics. You can block by Refcode to see cohort performance for every affiliate, or add a Refcode condition to isolate a specific partner.
Can I see the difference between real money and bonus play in Casino Game Metrics?
Yes. The Money Type filter in Casino Game Metrics separates real money sessions from bonus sessions. Switch between the two to compare GGR and RTP independently — this is the correct way to evaluate the true cost of bonus campaigns on game revenue. The same Money Type filter is available in Sports Betting Metrics, so you can separate real money and bonus bets the same way.
How do I export analytics data?
Click the Export button in the top-right corner of any analytics dashboard. The export reflects all active filters, Block By and Group By selections, and conditions at the time of the action. The file downloads as CSV and can be opened in Excel, Google Sheets, or any BI tool.
Is historical data available from before I integrated InTarget?
Historical data availability depends on the integration type and what data was migrated at onboarding. Your Dedicated Support Manager can advise on what historical data is available for your project and how to access it in the analytics dashboards.
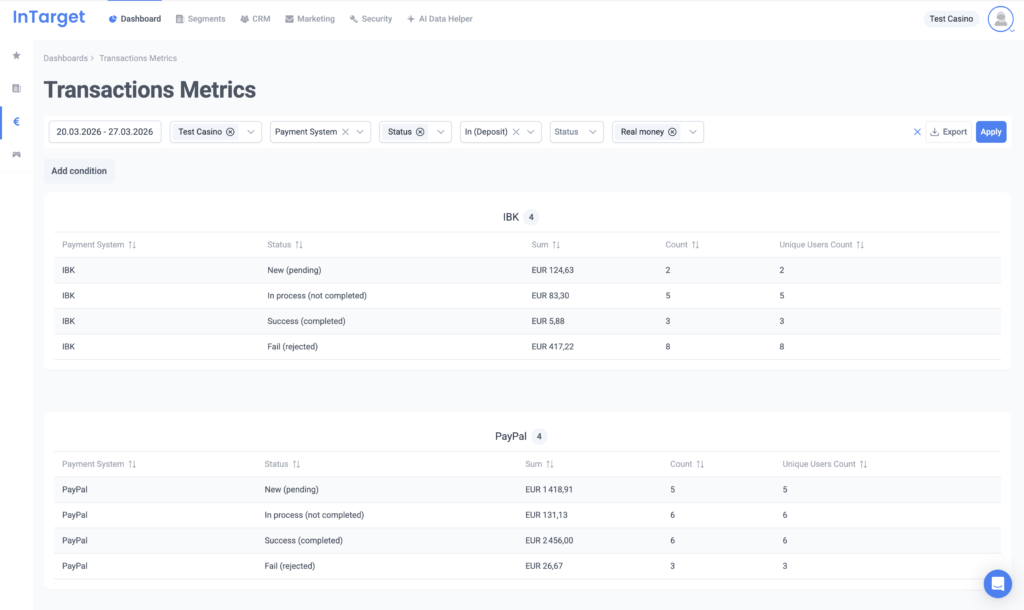
Transactions Metrics — Full Visibility Into Payment Activity
The Transactions Metrics dashboard tracks deposit and withdrawal volumes, transaction counts, and unique depositor numbers across every dimension that matters in iGaming: payment system, player country, currency, UTM source, and transaction status.
Block by Payment System to compare provider performance side by side. Filter by Status to isolate failed transactions per method — useful during provider incidents or integration testing. Block by UTM Source to connect deposit activity to the campaigns that drove it.
The UTM dimensions here are attached to the transaction itself, not the registration. This means re-deposits from existing players who returned via a campaign link are correctly attributed — not invisible, as they would be in registration-only attribution.
What Changes With Dedicated iGaming Analytics
Most operators make product and marketing decisions without the right data. Here is what changes when analytics is built into the CRM.
| Decision | Without Dedicated Analytics | With InTarget Analytics |
|---|---|---|
| Acquisition channel comparison | Registration volume only | FD conversion and Rev per Reg by UTM source |
| Payment system performance | Reports from finance team | Volume, count, and failure rate per provider |
| Game and sportsbook portfolio management | Provider-supplied reports | GGR and RTP per game and provider; GGR per sport and market |
| Bonus campaign evaluation | Total cost vs. total revenue | Real money GGR vs. bonus GGR, separated |
| CRM reporting | Export → pivot table → share | Filter → Export → share in seconds |
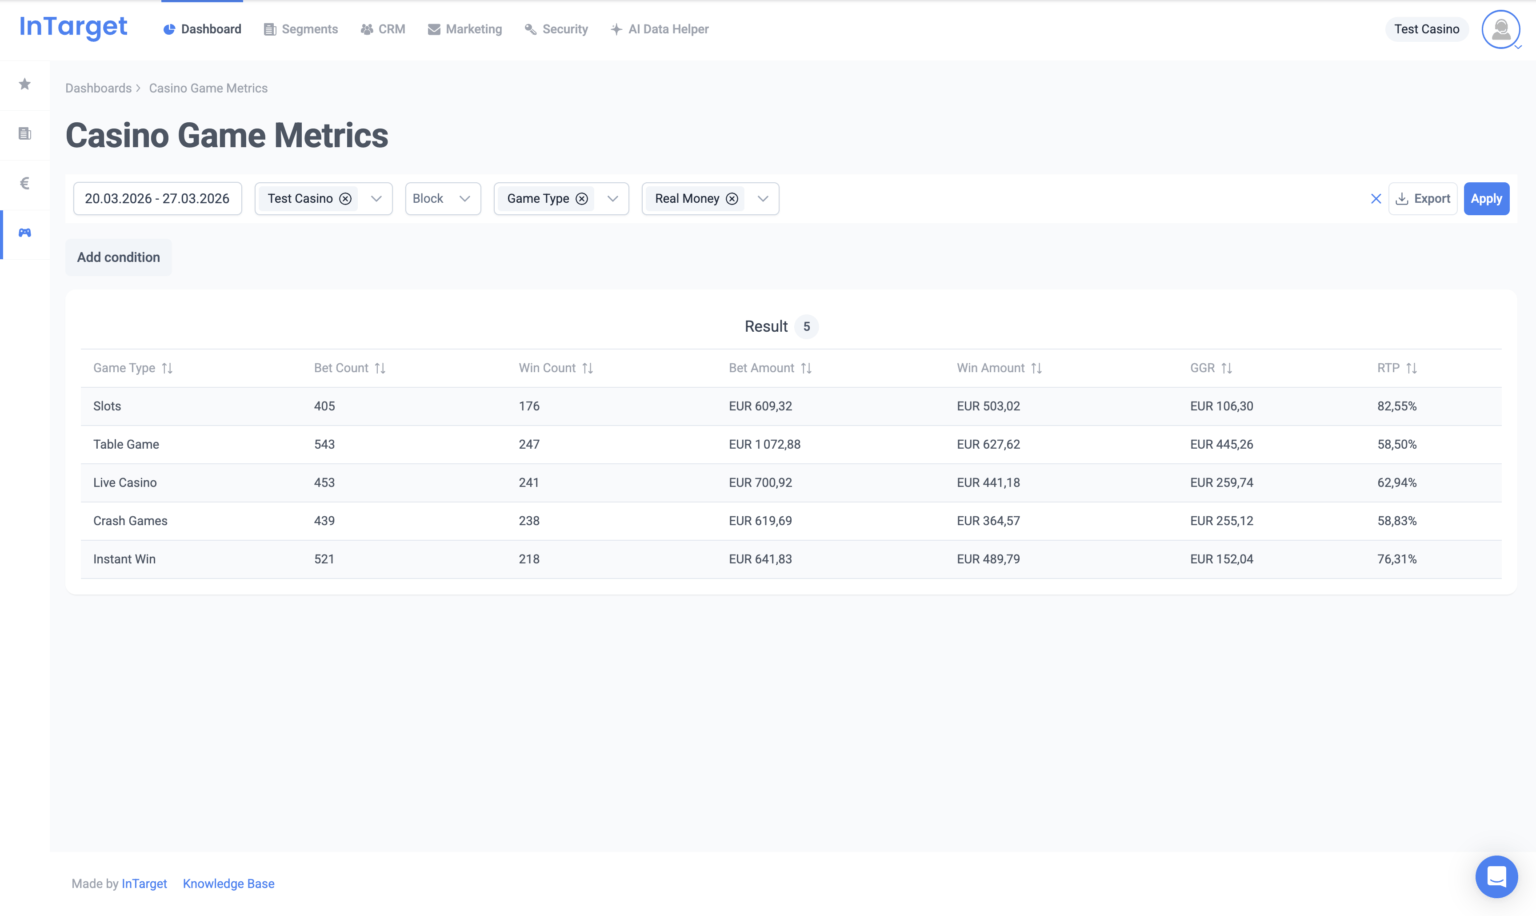
Casino Game Metrics — GGR, RTP, and Portfolio Performance
Casino Game Metrics tracks bet volume, GGR, and RTP by game name, provider, game type, and time. It gives operators the data they need to manage their game catalog without relying on provider-supplied reports.
Block by Game Provider to compare studios by GGR and RTP. Block by Game Name to rank individual titles. Block by Game Type to see how Slots, Live Casino, Crash Games, and Table Games contribute to overall revenue. Sort any column to surface your top performers — or identify games with abnormal RTP values.
Switch Money Type between Real Money and Bonus to isolate the true profitability of bonus campaigns. If a bonus drives most of its play on high-RTP titles, the nominal offer cost understates the actual revenue impact. This view makes that visible.
Sportsbook operators get the same depth from a parallel Sports Betting Metrics dashboard: bet volume, GGR, and unique players broken down by sport, tournament, event, market, and bet type, with the same Real Money vs. Bonus separation and Bet UTM attribution. Group by Sport Name to see which sports drive revenue, or isolate a single tournament to measure the markets that attracted the most action.
Made Specifically For:
InTarget works with all kind of iGaming businesses. Improve your LTV and Retention with us.


Ready to Scale Your Business?
Join 100+ operators who trust InTarget to grow their player base and maximize revenue.
Your product demo
Get to know InTarget from the scratch.
To book your personal product demo, fill out the form. Afterwards we will get in touch with you.
- Let us guide you through all areas of InTarget
- Learn all about our integrated features in a live presentation
- Tell us about your challenges and get direct feedback on your questions
Interactive Demo
Start your interactive demo now and experience the power of InTarget firsthand
Explore our CRM and Marketing Automation system to streamline player interactions and boost LTV