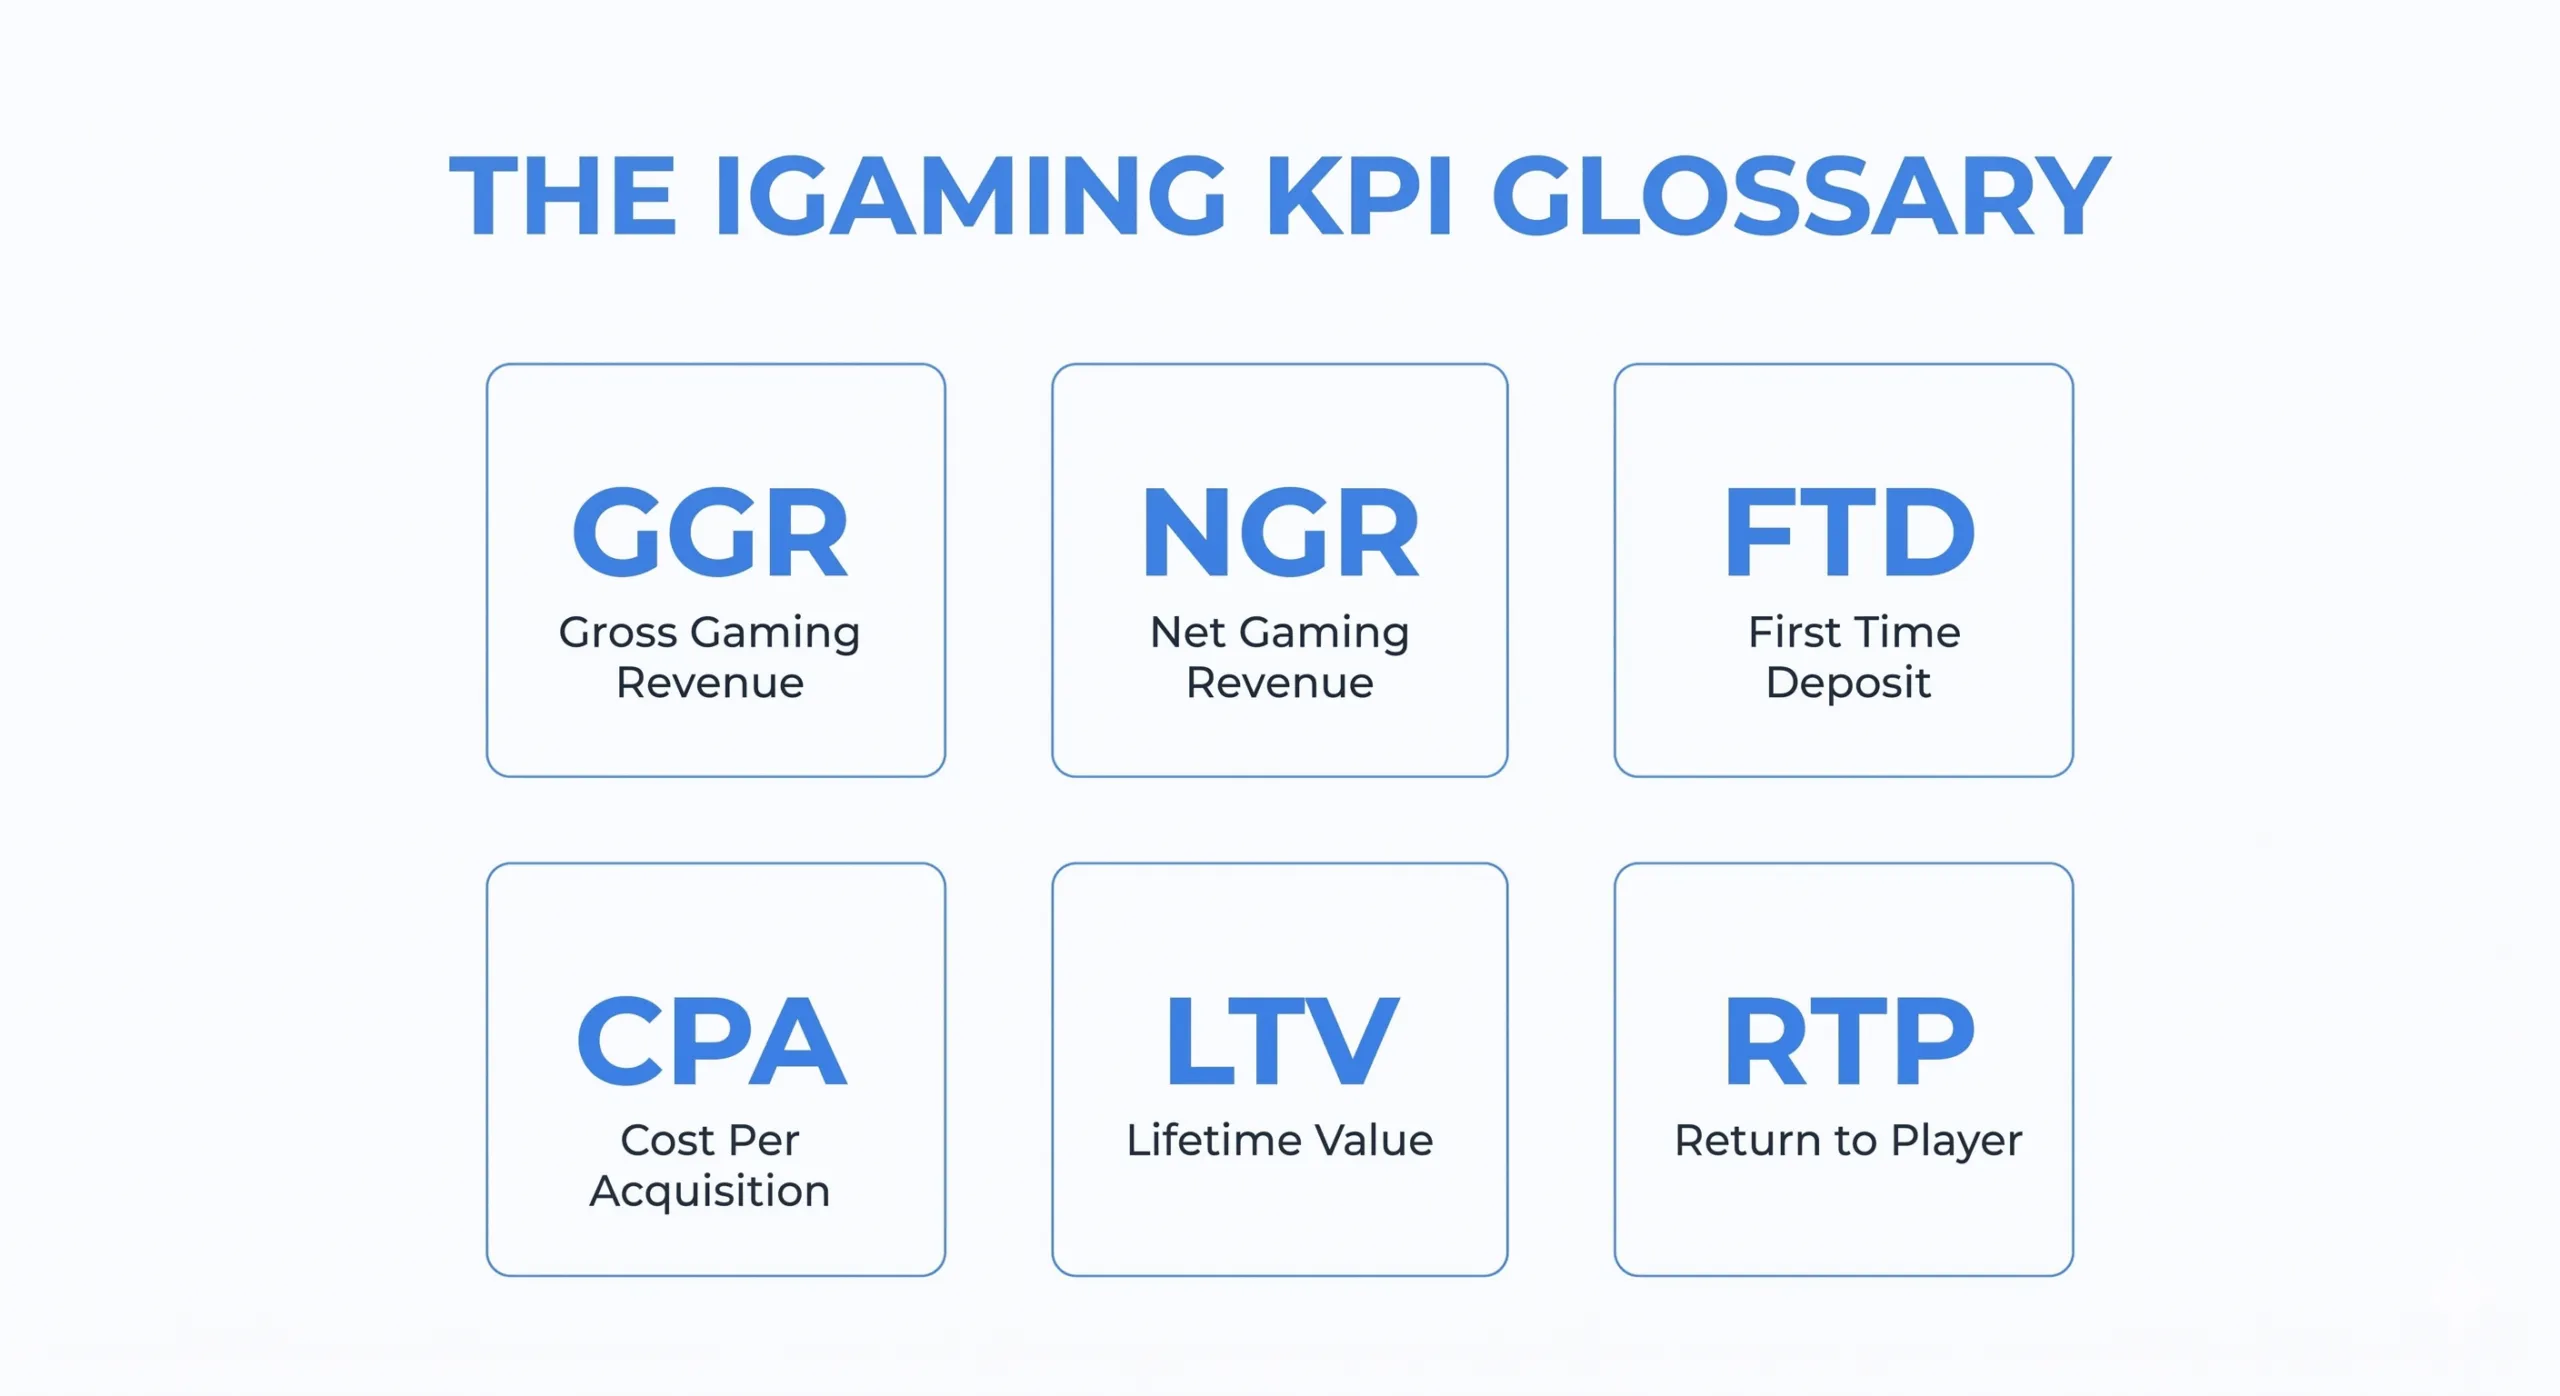
Quick reference: the 6 core iGaming KPIs at a glance
| KPI | Full name | Formula | What it measures |
|---|---|---|---|
| GGR | Gross Gaming Revenue | Total Bets − Total Winnings Paid | Top-line gambling revenue before deductions |
| NGR | Net Gaming Revenue | GGR − (Bonuses + Provider Fees + Payment Fees + Taxes) | Revenue retained after direct costs |
| FTD | First-Time Depositor (rate) | First-Time Depositors ÷ Total Registrations | Registration-to-deposit funnel health |
| CPA | Cost Per Acquisition | Marketing Spend ÷ First-Time Depositors | Cost to acquire one depositing player |
| LTV | Player Lifetime Value | Σ NGR per player − variable costs (cohort) | Total net value of a player relationship |
| RTP | Return to Player | (Player Winnings ÷ Total Stakes) × 100% | Game-level payout percentage |
Each metric is explained in operational depth below, with the CRM actions it drives.
Why most iGaming KPI glossaries don’t help you make decisions
Most iGaming KPI glossaries follow the same pattern: a list of acronyms, a one-line definition, a formula, and a CTA. That’s reference material. It doesn’t tell a retention manager what to do when D30 retention drops three points, or which segment to pause when CPA spikes 40% on a single GEO.
The KPIs below are the ones that actually drive operator decisions — what to acquire, who to retain, where to spend, and when to stop. Each definition is followed by the operational layer most articles skip: how the metric connects to player segments, lifecycle triggers, and CRM actions inside a working retention program.
This glossary is built for operators running CRM in-house, not for analysts maintaining quarterly reports.
The six KPIs that shape every iGaming retention decision
These six metrics form the operational core. Acquisition cost, revenue quality, retention quality, and game economics — together they describe the full P&L of a player base.
GGR — Gross Gaming Revenue (with formula and example)
Definition: Total amount wagered by players minus total winnings paid out.
Formula: GGR = Total Bets − Total Winnings Paid
What it tells you: Top-line gambling revenue before any deductions. It’s the headline number, but also the most misleading one in isolation — high GGR can sit on top of unprofitable players if bonus cost, payment fees, and taxes aren’t deducted.
Where it drives action: GGR is the input for almost every revenue ratio (NGR margin, GGR per active player, GGR by game provider). On the CRM side, GGR per segment is the cleanest way to value a cohort before bonus cost dilutes the picture.
NGR — Net Gaming Revenue: what you actually keep
Definition: GGR minus direct revenue costs — bonuses, jackpot contributions, provider fees, payment processing, and (depending on definition) gaming taxes.
Formula: NGR = GGR − (Bonuses + Provider Fees + Payment Fees + Taxes)
What it tells you: The revenue you actually keep. NGR is the metric that separates “we grew” from “we grew profitably.” In high-tax regulated markets where rates can run 20–50% of GGR, NGR can be a fraction of the top-line number.
Where it drives action: NGR by acquisition source is the only way to spot affiliate channels that look profitable on GGR but lose money on bonus cost. NGR per active player is the input you use to compare segments and decide where lifecycle investment goes.
FTD — First-Time Depositor and FTD Rate
Definition: A player who makes their first real-money deposit. FTD rate is the percentage of registrations that become depositors.
Formula: FTD Rate = First-Time Depositors ÷ Total Registrations
What it tells you: Whether your registration-to-deposit funnel is working. FTD rate exposes friction in onboarding, KYC, payment options, and welcome offer relevance. A weak FTD rate usually means the problem isn’t traffic quality — it’s the journey between sign-up and first deposit.
Where it drives action: This is the single most important conversion stage for CRM. Every operator should have a defined registration-to-FTD lifecycle: welcome message within minutes, payment-method reminder at 24 hours, no-deposit nudge at 48 hours, abandoned-deposit recovery if a deposit attempt fails. Tracking FTD rate by cohort tells you which acquisition source delivers depositors versus tire-kickers.
CPA — Cost Per Acquisition in iGaming
Definition: The marketing cost to acquire one depositing player — not one registration. Operators who count registrations as acquisitions are flattering themselves.
Formula: CPA = Total Marketing Spend ÷ Number of First-Time Depositors
What it tells you: Whether your acquisition is economic. CPA only makes sense paired with LTV — a $400 CPA is fine if 90-day NGR per player clears $600; it’s catastrophic at $300.
Where it drives action: CPA is set during acquisition but recovered through retention. The lifecycle question is always “how fast can we recover CPA?” According to regulated-iGaming agency analysis, FTD CPAs in the UK now routinely land between £250 and £600, with tier-one US states running higher — numbers that only work if the retention program is built to extend LTV well past month 3. Accurate CPA also depends on clean attribution: deposits need to be tied back to the campaign, channel, and message that produced them, which is the job of revenue attribution.
LTV — Player Lifetime Value (cohort-based)
Definition: The total net revenue a player generates over their active lifetime with your brand.
Formula (cohort-based): LTV = Σ NGR per player across cohort lifetime − variable costs (bonuses, payment fees, chargebacks)
What it tells you: Whether retention is actually working. LTV is the only metric that ties acquisition, activation, retention, and reactivation into a single number. Operators who optimize for FTDs without optimizing for LTV end up with expensive churn.
Where it drives action: LTV is calculated by cohort, not by player average. Acquisition cohorts (week of registration, GEO, source) reveal which channels deliver players worth retaining. Inside the CRM, LTV is the basis for VIP tiering, reactivation budgets, and the size of personalized bonuses. The LTV:CAC ratio is the single number most operators use to defend or kill an acquisition channel.
RTP — Return to Player explained
Definition: The percentage of stakes a game pays back to players over time, calculated as winnings paid divided by handle. House edge is its inverse.
Formula: RTP = (Total Player Winnings ÷ Total Stakes) × 100%
What it tells you: Game economics, not player economics. RTP is a game-design parameter set by the provider — slot RTP usually sits between 94–98%, table games higher. It’s observed at the casino level over large sample sizes.
Where it drives action: RTP doesn’t directly drive CRM messaging, but it shapes everything downstream. Game mix decisions (which providers to feature), bonus structuring (wagering on high-RTP slots vs. low-RTP), and player communication (RTP-based promotions for value-seeking segments) all flow from it. Tracking realized RTP per game and per cohort reveals whether players are running hot or cold — a relevant signal for retention timing.
Why generic CRMs fail at iGaming KPIs
Most operators don’t fail to track these metrics. They fail to act on them.
The breakdown usually happens in three places. First, the analytics live in one system (a BI tool or platform dashboard) while the CRM lives in another, and there’s no path from “ARPPU dropped 12% in this segment” to “trigger reactivation flow.” Second, generic CRMs don’t understand iGaming primitives — they track opens and clicks but have no concept of GGR per segment, bonus cost per cohort, or FTD attribution. Third, the data refresh is too slow: yesterday’s NGR doesn’t help you retain a player who’s churning today.
An iGaming-native CRM closes this loop. KPI dashboards, player timeline, segmentation, and lifecycle automation sit on the same data layer, which means a drop in deposit frequency for a segment can automatically trigger a reactivation flow without anyone exporting a CSV.
Common KPI comparisons operators search for
Two of these metrics are most often confused with their close relatives. Both comparisons matter because the wrong choice produces misleading dashboards.
GGR vs NGR: what’s the difference
GGR is total bets minus winnings paid out — the gross revenue from gambling activity. NGR subtracts everything you spent to produce that revenue: bonuses, provider fees, payment processing, and (depending on definition) gaming taxes. The gap between GGR and NGR is the operator’s true cost of doing business per euro wagered. Reporting GGR externally is standard; running internal decisions on GGR is dangerous, because two channels with identical GGR can have wildly different NGR once bonus cost and tax burden are applied. Always pair GGR with bonus cost ratio when evaluating segments.
ARPU vs ARPPU: why CRM teams use ARPPU
ARPU (Average Revenue Per User) divides total revenue by all active players in a period — depositing and non-depositing. ARPPU (Average Revenue Per Paying User) divides revenue only by depositing players. The difference matters: ARPU includes the long tail of registered-but-never-deposited accounts, which drags the average down and hides the real value of your paying base. CRM teams use ARPPU because it reflects the players you can actually retain. ARPU is fine for top-of-funnel health and investor decks; ARPPU is the metric you build segmentation and VIP tiering on.
The KPI → CRM action framework
These KPIs aren’t a reporting checklist — they’re inputs into segmentation and automation. The table below is how a working retention team translates each metric into a decision.
| KPI | Primary owner | Decision it drives | CRM action |
|---|---|---|---|
| GGR | Commercial | Game and provider mix | Re-weight game promotions; spotlight high-margin verticals |
| NGR | Finance / CRM | Bonus and channel ROI | Cap promotions on unprofitable cohorts; re-route spend |
| FTD rate | CRM / Acquisition | Onboarding funnel health | Adjust welcome flow timing, channels, and offers |
| CPA | Acquisition | Channel economics | Pause/scale channels based on LTV:CPA ratio |
| LTV | CRM | Retention investment per segment | Tier VIP program; size reactivation bonuses |
| RTP | Product | Game and bonus design | Structure wagering by RTP band; target value-seekers |
The framework is the same across operators: every KPI is owned by someone, drives a specific decision, and triggers a specific CRM action. When this loop is broken, KPIs become reporting artifacts instead of operating tools.
Supporting iGaming KPIs every retention team tracks
The six metrics above are the core, but they don’t sit alone. The KPIs below are what retention teams use to diagnose movement in the core six.
- Deposit frequency: Average deposits per active player per week or month. A leading indicator of churn — falling frequency precedes churn by weeks.
- D1 / D7 / D30 / D90 retention: Percentage of a registration cohort still active at days 1, 7, 30, and 90. D30 and D90 are the lifecycle benchmarks that separate platforms retaining players from those churning them.
- Churn rate: Percentage of previously active players who become inactive in a given period. Defined per operator (usually 30 or 60 days of inactivity); the definition needs to be stable to be useful.
- Reactivation rate: Percentage of churned players who return to active status. The KPI that tells you whether your win-back program is real or theater.
- Conversion rate (deposit-to-bet, bonus-to-real-money): Funnel metrics inside the depositor segment. These reveal friction inside the product, not just at the top of the funnel.
- Bonus cost ratio: Bonus cost as a percentage of GGR. The KPI that quietly destroys margin if no one owns it.
Related terms you’ll encounter
A short reference for adjacent metrics and concepts that appear in iGaming analytics and CRM workflows.
- Active player: A player with at least one bet, login, or deposit inside a defined window — most commonly 30 days. The exact threshold matters less than keeping the definition stable over time.
- MAU / DAU: Monthly and Daily Active Users. The DAU/MAU ratio is the standard stickiness metric — higher values mean players return more frequently within the month.
- Churn cohort: A group of players who became inactive in the same period. Cohort churn analysis reveals which acquisition sources, product changes, or campaigns drove the loss.
- Bonus abuse: Players or syndicates exploiting promotional offers for guaranteed profit — multi-accounting, advantage play, low-risk arbitrage. Tracked through bonus cost ratio outliers and isolated in CRM segments to throttle or block.
- Responsible gambling (RG) KPIs: Self-exclusion rate, deposit limit adoption, session-length flags, and intervention contact rate. Increasingly tracked alongside commercial KPIs as both regulatory obligation and a long-term retention signal.
How retention CRMs operationalize iGaming KPIs
The job of a CRM in 2026 isn’t to display these numbers — it’s to act on them. A few concrete examples of how each metric flows into automation:
- FTD rate triggers — A registration without a deposit at 24 hours fires a welcome reminder; at 48 hours, a no-deposit incentive; at 72 hours, the player moves to a lower-cost re-engagement track. The trigger doesn’t fire on a calendar — it fires on the absence of an event.
- LTV-based VIP tiering — Players crossing defined cumulative NGR thresholds move automatically into behavior-based segments with different communication frequency, bonus sizing, and dedicated host assignment.
- Churn-risk segmentation — Players whose deposit frequency drops 50% versus their 30-day baseline enter a churn-prevention flow before they’re technically churned.
- CPA-aware reactivation — Reactivation bonuses are sized relative to original CPA, not as a flat amount, so the operator never spends more to win a player back than they did to acquire them in the first place.
- GGR-by-segment dashboards — Real-time visibility on which cohorts are producing GGR right now, so reallocation happens within days, not at the next quarterly review.
Platforms like InTarget are built to make this loop operational for small-to-mid-size operators — iGaming analytics, player timeline, segmentation, and lifecycle marketing automation sit on the same data layer, which means metric thresholds can directly drive triggers without engineering work. For growing operators evaluating alternatives to enterprise CRMs like Optimove, the practical value of an iGaming-native CRM is exactly this — the KPIs and the actions they should trigger live in the same place.
Benchmarks: why there’s no universal iGaming KPI benchmark
There’s no single benchmark that holds across markets. CPA in the US regulated market behaves nothing like CPA in LATAM. Retention curves in crypto casinos run differently from regulated EU sportsbooks. The useful work isn’t comparing your numbers to industry medians — it’s tracking the slope of your own KPIs week over week, cohort over cohort. The operators who win are the ones who notice movement in their own data faster than competitors notice movement in theirs.
Frequently asked questions
What’s the difference between GGR and NGR?
GGR is total bets minus winnings paid — the gross revenue from gambling activity. NGR subtracts direct revenue costs (bonuses, provider fees, payment processing, and often taxes). GGR is your top-line; NGR is what you actually keep.
Is RTP a CRM KPI?
Not directly. RTP is a game-economics parameter set by providers. It influences CRM decisions (bonus structuring, game mix in campaigns) but isn’t itself a metric you optimize through retention activity.
How is LTV calculated for an iGaming operator?
The practical method is cohort-based: take a registration cohort, sum NGR per player across the lifecycle window (30/90/180 days), subtract variable costs like bonus cost, payment fees, and chargebacks. Average LTV across the cohort is the working number; per-player LTV is used inside segmentation.
What’s a good CPA in iGaming?
There’s no universal number — CPA only makes sense relative to LTV. In top regulated markets (US, UK), CPA for depositing players frequently runs from $200 to over $500 depending on channel. A working rule: target LTV:CPA of at least 3:1 within 12 months for the channel to be sustainable.
How often should an operator review these KPIs?
Weekly for operational metrics (FTD rate, deposit frequency, bonus cost ratio), monthly for strategic metrics (LTV, NGR by cohort, retention curves). Reviewing LTV daily is noise; reviewing FTD rate quarterly is malpractice.
What’s the relationship between FTD rate and CPA?
A weak FTD rate inflates CPA mechanically — if half your registrations don’t deposit, your acquisition cost per depositor doubles. Improving the registration-to-FTD funnel through CRM is often the fastest way to lower effective CPA without changing media spend.
Can a small operator run all of these KPIs without a BI team?
Yes — modern iGaming-native CRM platforms include the analytics needed to track these metrics, with cohort views, segmentation, and conversion attribution built in. A single CRM manager with the right platform can run weekly KPI reviews and drive retention decisions without dedicated BI support.